Agras T50 for Urban Field Monitoring: A Practical Workflow
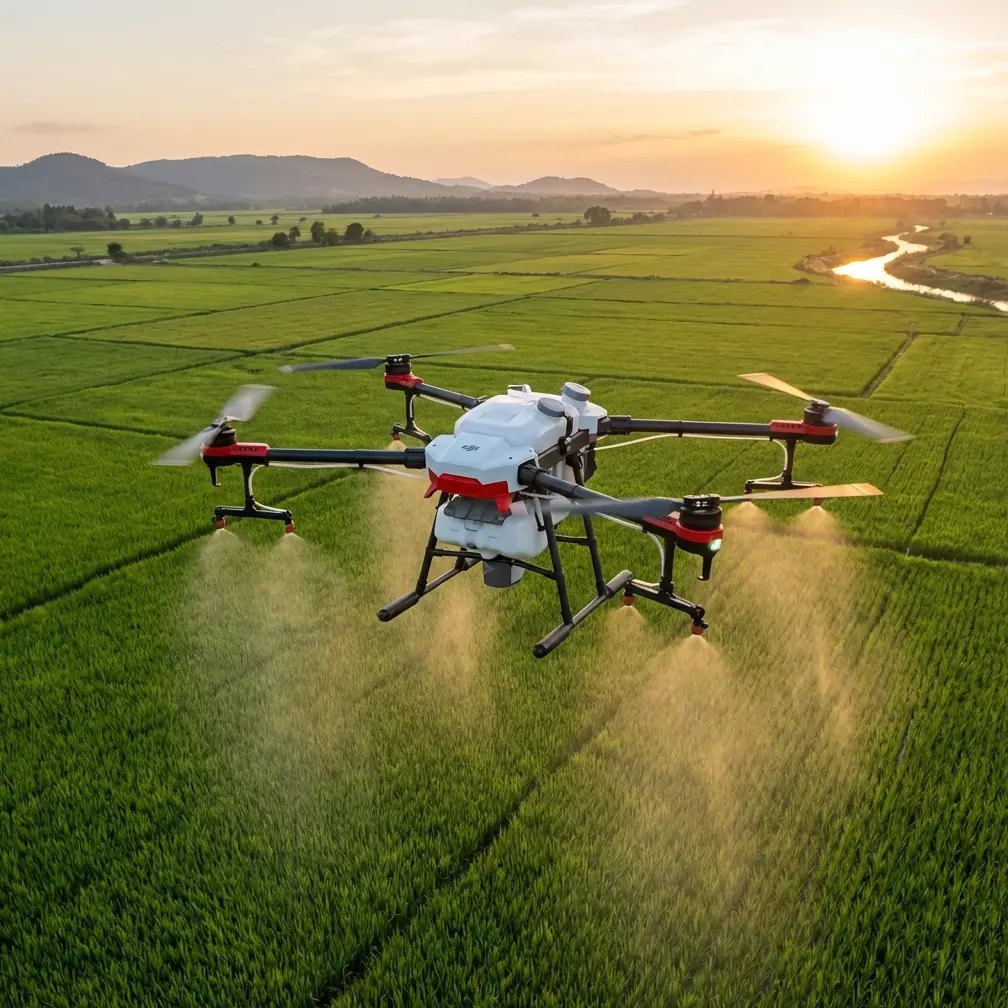
Agras T50 for Urban Field Monitoring: A Practical Workflow That Treats Data Quality Like Flight Safety
META: A field-tested Agras T50 monitoring workflow for urban agriculture, covering overlap targets, flight stability, impact data awareness, battery handling, and why precision processing matters.
Urban field monitoring sounds simple until you actually do it.
A few blocks of cultivated land tucked between roads, buildings, drainage channels, and utility corridors can be harder to monitor than a broad rural parcel. Wind behaves differently. GNSS conditions can shift near structures. The margin for sloppy flying is thin. If you are using an Agras T50 around urban agriculture, the real skill is not just getting airborne. It is producing repeatable, useful field intelligence while keeping the aircraft, batteries, and data pipeline under control.
That is where many operators go wrong. They think in terms of aircraft capability first. The better approach is to think in terms of evidence. What data are you trying to capture, how clean does it need to be, and what operating discipline protects both the drone and the output?
The most useful way to frame the Agras T50 in this setting is as a precision field platform that benefits from two worlds of drone practice: agricultural execution and survey-grade discipline. The reference material behind this article might seem unrelated at first glance, but it points to an unusually practical lesson. Good urban field monitoring comes from combining careful flight logging with rigorous image planning.
Why urban field monitoring demands tighter discipline
In open farmland, you often have room to absorb small mistakes. In urban agriculture, those mistakes become visible fast. A slight yaw instability can distort coverage along narrow plots. A weak RTK fix rate can create inconsistency between repeat missions. Spray drift risk rises when air currents bounce off nearby structures. Even if your mission is monitoring rather than application, the same environmental constraints apply.
This is why centimeter precision matters more in urban plots than many operators expect. If you are comparing crop condition over time, trying to detect irrigation stress along edges, or checking variation near paved heat islands, your data needs positional consistency. Otherwise, what looks like crop change may just be alignment error.
There is a useful parallel in low-altitude photogrammetry standards. One technical reference specifies a forward overlap target of 60% ±5% and side overlap of 30% ±5%, with image tilt kept to no more than 2°, image rotation under 6°, and route curvature at 3% or less. Those numbers come from mapping practice, not crop spraying. But they matter here because they express a mindset: stable geometry produces trustworthy outputs.
For Agras T50 monitoring missions in urban fields, that mindset is gold.
What those overlap and attitude numbers really mean for a T50 operator
Let’s translate them into operational significance.
If your monitoring workflow includes visual field documentation, stand count review, edge-condition checks, drainage inspection, or stitched imagery for agronomic comparison, then overlap is not a side issue. It determines whether your software has enough consistent visual information to reconstruct the site accurately. Forward overlap around 60% helps maintain continuity along the line of flight. Side overlap around 30% supports cross-track consistency and reduces gaps in interpretation.
The attitude limits are just as important. A tilt greater than 2° or excessive image rotation can complicate post-processing and make comparisons less reliable, especially in small urban plots where every edge and path is close to the subject area. If your Agras T50 is flying in gusty, channelized wind between buildings, those errors show up quickly.
This is one reason swath width should not be treated as a bragging-rights metric in urban monitoring. Wider coverage is useful only when stability stays high and the data remains interpretable. In dense edge environments, it is often smarter to fly a more conservative pattern with predictable line spacing than to chase maximum area per sortie.
The hidden lesson from crash-data education
One of the more interesting source details comes from a DJI educational document discussing drone fall data. In a test from 80 centimeters, the maximum Z-axis acceleration can exceed 4000, and the impact value changes depending on the surface material. Softer ground reduces peak acceleration.
At first that may sound like a classroom curiosity. It is not.
It is a reminder that even a short drop can create severe stress in the aircraft structure or payload system. For Agras T50 operators working around urban fields, this matters in two ways.
First, low-altitude incidents are not trivial just because the aircraft was close to the ground. A hard touchdown near a field edge, concrete service road, or irrigation hardware can generate loads high enough to justify a full inspection before the next mission. Second, the surface itself changes the damage profile. A drone that clips down onto compacted pavement experiences a different shock event than one settling into softer soil.
That is why serious operators should think a little like the aviation world thinks about a flight recorder. The same source explains the history of the so-called black box, including why it became bright orange for easier recovery. The deeper point is not the color. The point is recoverable evidence. If an abnormal event occurs, you want logs, attitude data, height readings, and battery history available so the next decision is based on facts, not memory.
For the Agras T50, this translates into a simple habit: after any abrupt landing, prop strike, sudden motor stop event, or unexplained attitude spike, review your logs before resuming regular field work. If available, note TOF height at the moment the event began, peak acceleration behavior, and maximum attitude angle deviation. That process turns one-off scares into usable operational intelligence.
A practical T50 monitoring workflow for urban fields
The best urban monitoring routine with an Agras T50 is not complicated, but it needs consistency.
1. Start with a geometry-first mission plan
Before takeoff, decide whether this is a repeatable monitoring pass, a one-time diagnostic inspection, or a pre-application assessment. For repeatable monitoring, hold route structure as constant as possible. Similar altitude, similar speed, similar line spacing, similar entry heading. The goal is comparative reliability, not visual novelty.
If you are capturing imagery or visual evidence for stitching, use the mapping reference values as a discipline benchmark: aim for roughly 60% forward overlap and about 30% side overlap, then verify that your flight attitude remains controlled enough to keep image tilt and rotation within reason. Even when your exact software stack differs, the principle holds.
2. Watch RTK behavior before trusting the mission
Urban environments punish complacency. Buildings, reflective surfaces, and local obstructions can degrade satellite geometry or create unstable corrections. A good RTK fix rate is not just nice to have. It underpins repeatability from one mission to the next.
If the fix rate is unstable at your launch point, do not assume it will improve over the field. Test briefly, confirm the aircraft settles into consistent positioning, and only then proceed with your monitoring route. If your objective is centimeter precision around narrow field margins, weak RTK conditions can quietly ruin the value of the dataset.
3. Respect wind because it affects both monitoring and spray drift planning
Even if today’s mission is observation only, wind matters. The same local currents that push droplets during application can skew attitude and route consistency during monitoring. In urban fields, crosswinds often behave unevenly due to walls, roads, and tree lines.
That means your monitoring pass is also a rehearsal for future nozzle calibration and drift control decisions. If one edge of the plot consistently shows aircraft correction or yaw compensation, that area deserves extra caution on application days. Monitoring flights can reveal drift-risk zones before liquid ever enters the system.
4. Build battery discipline into the mission, not after it
Here is the field tip I give operators more often than almost anything else: do not treat battery swaps as a purely logistical pause. Use them as your quality-control gate.
After each pack, take 60 seconds. Check battery temperature trend, connector condition, and whether the aircraft is showing any subtle behavior change—slower climb response, rougher hover, attitude twitch on braking, or irregular descent feel. In urban field operations, sorties are often shorter and more fragmented than broad-acre work. That can trick crews into overlooking battery stress because no single flight feels demanding.
But repeated stop-start work, road-adjacent launches, and hot pavement staging areas can stack thermal load in ways operators underestimate. My rule is simple: if a battery comes off warmer than expected and the next mission is precision monitoring near obstacles or boundaries, let that pack rest longer than your schedule wants. Fast turnaround is not worth degraded consistency.
This is especially relevant when you want stable image geometry. Aircraft behavior that is only slightly off can still corrupt the quality of your monitoring output.
Why post-processing quality matters as much as flight quality
A second technical source in the reference set highlights something many field teams ignore: low-altitude drone imagery often creates a high volume of small-frame images, and those images require proper correction using camera calibration, pose data, and geometric models. In other words, collecting the imagery is only half the job.
The example cited in the source is DPGrid, whose advantage includes intelligent point selection and local free-network bundle adjustment using 6 images across adjacent flight strips to eliminate mismatched points. You do not need to use that exact software for the lesson to matter. The operational significance is clear: robust processing can remove weak matches and preserve accuracy when the environment is visually complex.
Urban agricultural fields are exactly that kind of environment. You may have crop rows next to reflective roofs, fences, service roads, plastic cover, water features, and shade transitions. Weak software handling can create false alignments or lower-confidence models. Better processing workflows help separate crop reality from visual noise.
So if your Agras T50 monitoring program is feeding agronomy, irrigation checks, or record-keeping, invest attention in the processing chain. Smart alignment, quality checks on flight lines, and manual review of suspect control features are not office luxuries. They are part of the mission.
What this means for an Agras T50 operator on the ground
The Agras T50 is often discussed in terms of field efficiency, application capacity, and hardware toughness. Those things matter. But for urban field monitoring, the stronger lens is this: can the aircraft support a disciplined, evidence-based operating method?
That means:
- stable enough flight to preserve useful overlap and attitude control
- repeatable route execution with strong RTK integrity
- awareness of spray drift implications even during monitoring-only missions
- battery handling that protects consistency, not just uptime
- log review habits that borrow from flight-recorder thinking
- post-processing standards that respect how fragile image quality really is
When those pieces come together, the T50 becomes more than a field machine. It becomes part of a repeatable observation system.
A note on learning from the wider low-altitude industry
The reference news item about the 2026 Guangzhou International Low-Altitude Economy and Aerospace Exhibition, scheduled for June 2026 at the China Import and Export Fair Complex in Guangzhou, is a useful reminder that agricultural drones are no longer operating in a silo. They sit inside a broader low-altitude ecosystem that includes robotics, AI, processing software, flight systems, and operational infrastructure.
That matters for Agras T50 users because urban field monitoring increasingly depends on cross-domain thinking. Better automation, better data handling, and better integration with planning tools will come from that wider ecosystem, not only from spray equipment discussions.
If you follow these developments and want to compare workflows, field setups, or monitoring routines with someone who works directly in this space, you can message a drone consultant here.
The operator standard that actually holds up
The best Agras T50 monitoring results in urban agriculture do not come from flying harder. They come from flying cleaner.
Use overlap targets and attitude limits borrowed from serious photogrammetry practice. Respect the warning embedded in short-drop acceleration data; even minor incidents can carry major mechanical significance. Treat battery swaps as inspection checkpoints. Preserve logs the way aviation treats recorded evidence. And never separate field data quality from flight discipline.
That is the standard that scales. It is also the standard that keeps your monitoring outputs useful week after week, especially in urban environments where the margin for noise, drift, and inconsistency is small.
Ready for your own Agras T50? Contact our team for expert consultation.